Occupiers plan for 74% utilisation and get 56%. Here's how to plan around real scenarios, not one target.
- JLL's newest occupancy benchmark found organisations plan for 74% utilisation and actually get 56%, an 18-point miss that barely closed even with better reporting.
- Two more 2026 benchmarks show the same story from different angles: allocated seats running at 111% of headcount while daily use sits at 53%, and specialist space used at 45% against a 72% target.
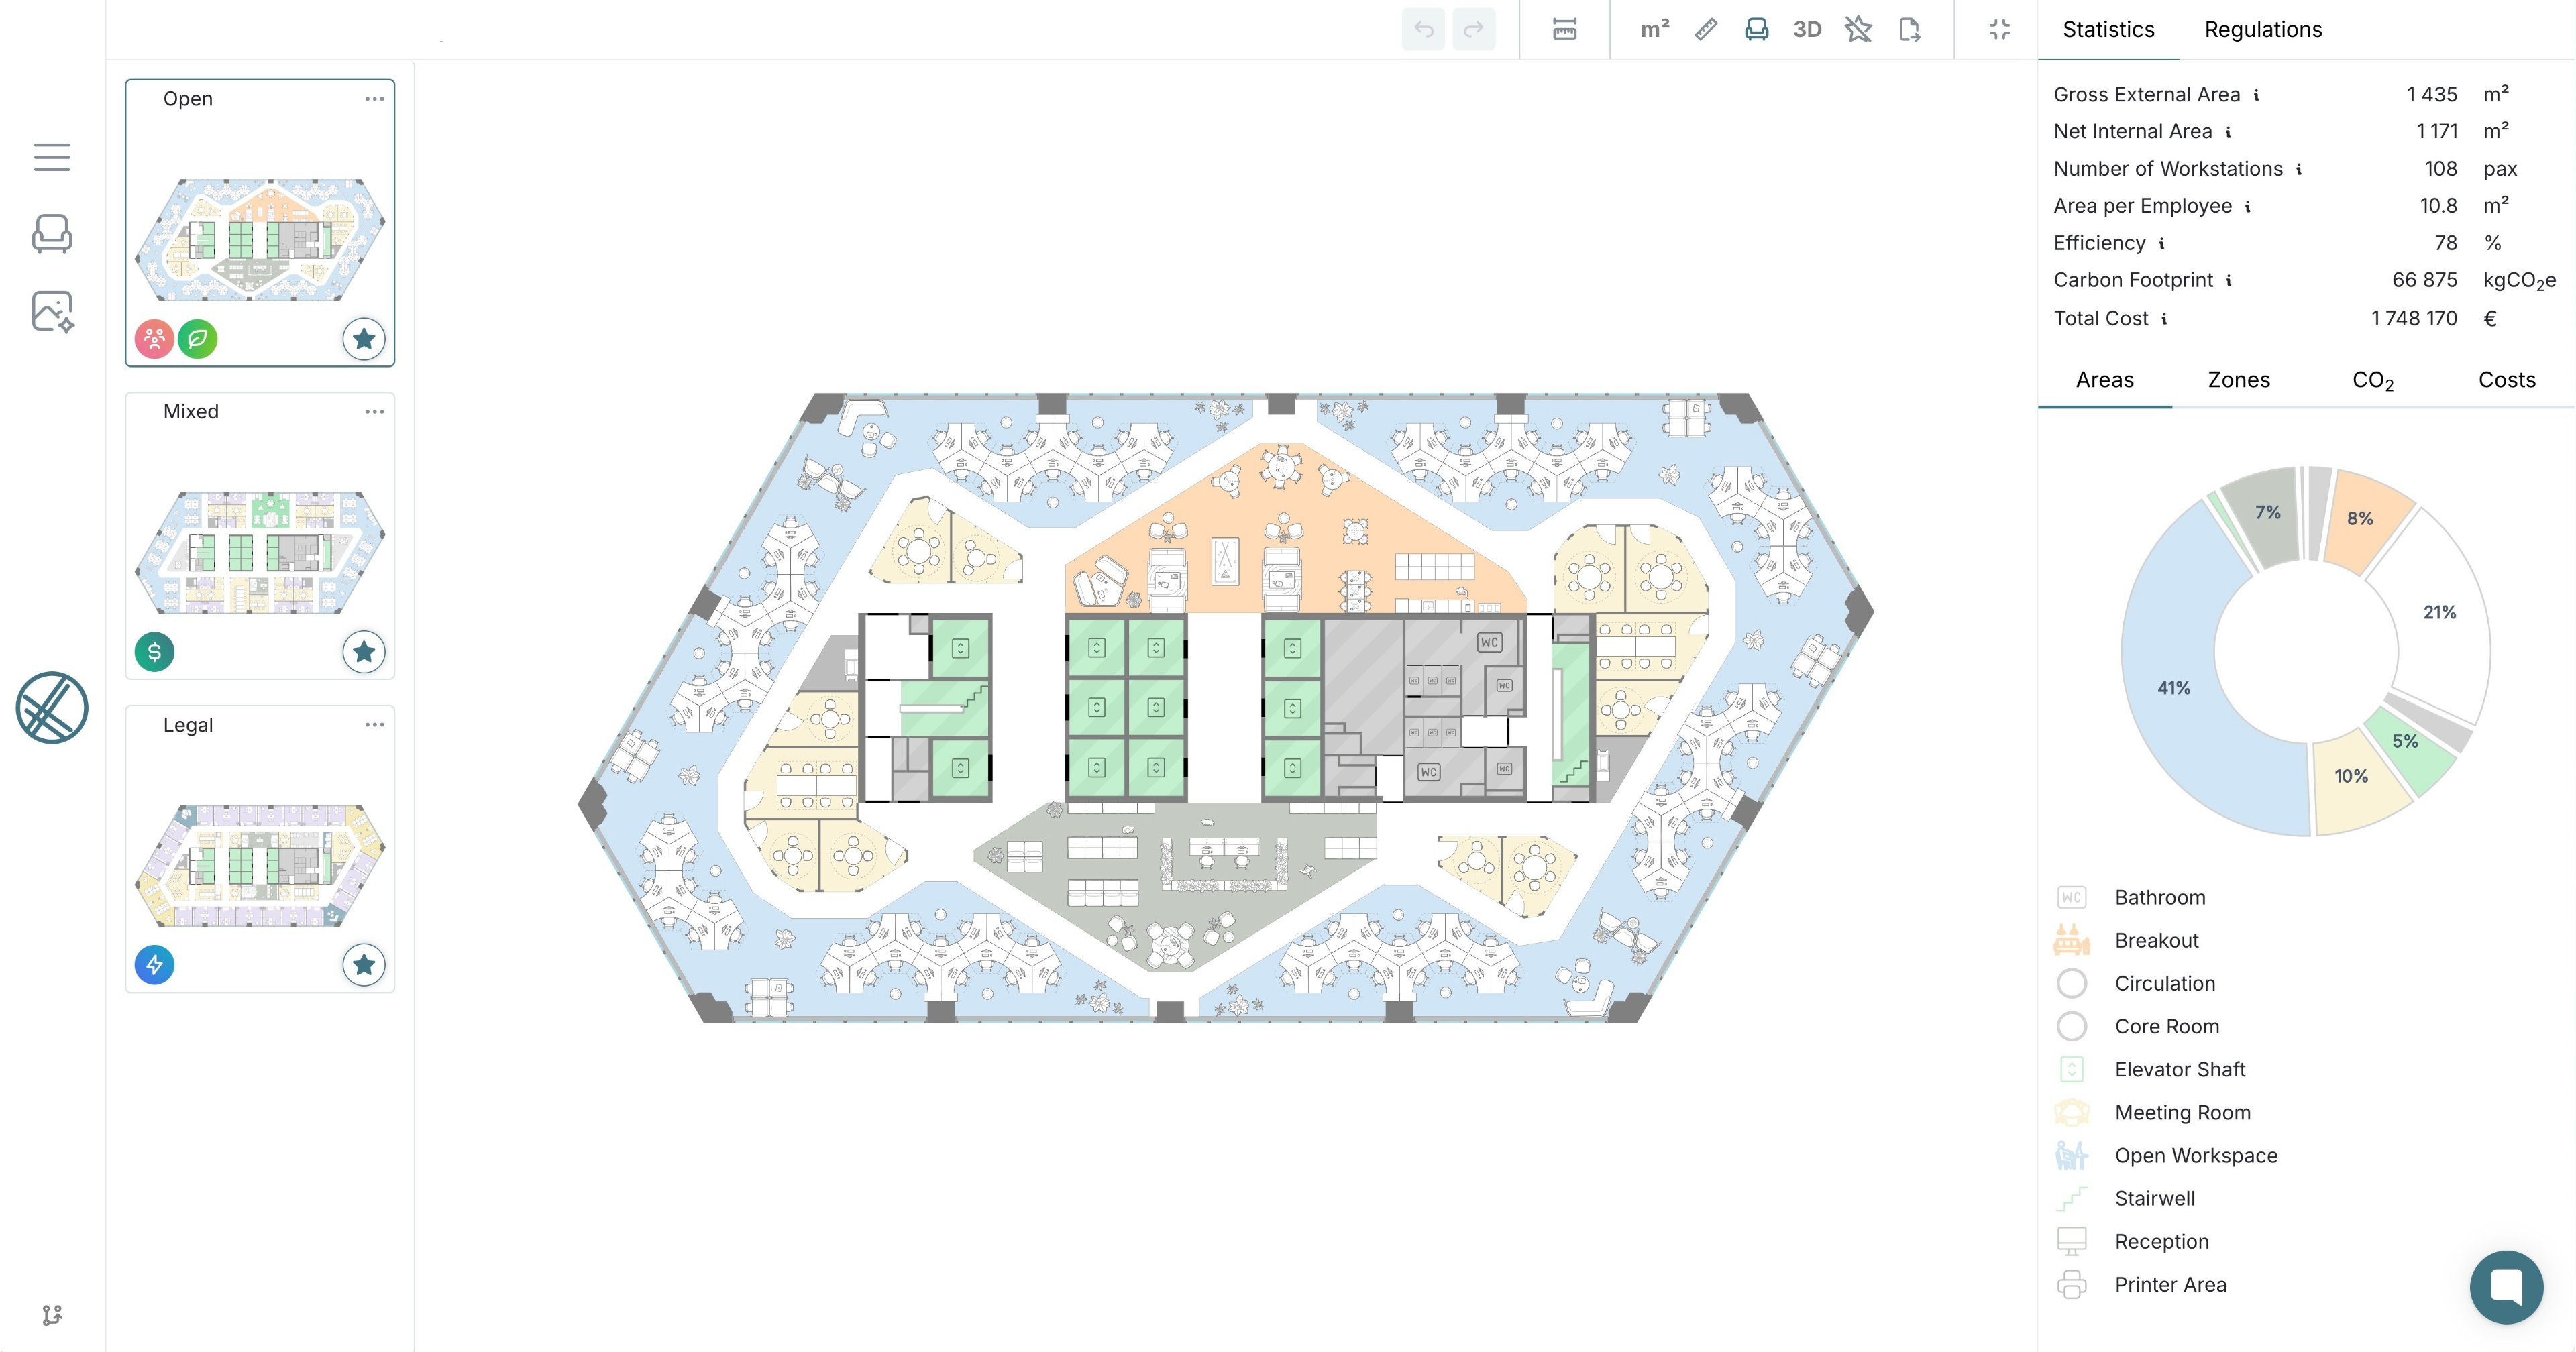
- laiout lets occupiers model several attendance and headcount scenarios against the real floor plate, so a plan reflects a range of outcomes instead of one target number that keeps missing.
Every occupier plans a floor around a target utilisation rate, then finds out it isn't the rate they get. JLL's newest occupancy benchmark, covering 84 organisations across 716 million square feet, found the industry plans for 74% utilisation and lands at 56%, an 18-point miss that only narrowed from 25 points the year before, even as data governance and reporting improved.
- The miss shows up everywhere you measure it: A separate 2026 benchmarking round found allocated seats running at 111% of physical headcount while average daily use sat at just 53%, the gap created by attendance concentrating into two or three midweek days rather than spreading evenly across five.
- Specialist space misses by even more: The same benchmark data found technical and lab-style space running at just 45% utilisation against a 72% target, a wider gap than general desk space, because that inventory gets sized to a worst case that rarely arrives.
- The gap survives better data, not just bad guessing: Data governance programmes are now in place at most large occupiers, and the miss has still barely moved year on year, suggesting the target number itself, not the tracking behind it, is the problem.
A single utilisation percentage cannot describe a floor that is nearly full on Tuesday and half empty on Friday. Occupiers keep refining how they measure the miss instead of changing what they plan against, the same discipline behind why European occupiers are having to move faster than their own approval cycles in a market that has already moved on.
- Model more than one target number: Upload the floor plate and generate layouts against several attendance and headcount scenarios side by side, using the same test fit modelling that replaces days of manual planning, so the plan reflects a range your committee can actually defend.
- See the peak, not just the average: Compare a Tuesday-level scenario against a full-week average in the same output, so the space is sized to the day it needs to work, not a number that was never going to be typical. Share both scenarios with stakeholders as one interactive laiout link, so the committee sees the actual trade-off rather than a description of it.
- Adjust the moment the real pattern shows up: Freeze what's working and regenerate the rest in minutes once actual attendance data comes in, storing every version in laiout Hub so the plan that was wrong on day one doesn't stay the reference version for the rest of the lease.
Q: Is this just a hybrid work problem?
Partly, but the miss predates hybrid work. The BCO's own 2018 study found average office utilisation at 40 to 60% before the pandemic, with midweek peaks of only 33%, so the gap between planned and actual use is a long-standing measurement problem that hybrid work has made harder to ignore.
Q: Does better attendance tracking software fix this on its own?
It helps diagnose the size of the miss, which is genuinely useful, but the benchmark data shows the gap has barely closed even as tracking has improved. The fix is testing several scenarios against the actual floor plate, not measuring the same single target more precisely.
Q: How fast can a team actually compare scenarios before a lease decision?
Minutes, from an uploaded floor plate. Comparing a peak-day scenario against an average-week scenario for the same floor typically takes under an hour, well within a committee's usual review window.
An 18-point gap that survives better data governance is not a measurement failure. It is what happens when a single target is asked to describe a floor that behaves completely differently depending on the day. The occupiers closing that gap are not the ones with the most detailed dashboard, they are the ones who stopped expecting one number to hold.
Book a demo with laiout today and test your next floor against more than one version of how it will actually be used.
- JLL's 2026 global occupancy benchmark found organisations plan for 74% utilisation and achieve 56%, an 18-point gap.
- That gap narrowed from 25 points the year before, the first improvement since tracking began, but has still not closed.
- A separate 2026 benchmark found allocated seats running at 111% of headcount while average daily use sat at 53%, driven by midweek attendance peaks.
- Technical and specialist space misses its target by even more, running at 45% utilisation against a 72% target.
- The gap has persisted even as data governance and reporting have improved, pointing to the planning method rather than the data itself.
- laiout lets occupiers model multiple attendance scenarios against the real floor plate, rather than planning to a single target number that keeps missing.
- How Much Office Space Per Person Do You Need for Your Workplace?, Office Space Software, 7 September 2026.
- Hybrid Office Space Utilization: Why Average Occupancy Leads to Poor Office Sizing, Limitless Workspace, 5 August 2026.
- Office Space Utilization Benchmarks for 2026, Butlr, 7 August 2026.
Author: Theodore Harding, laiout
Get laiout News and Updates right in your inbox.

We're always open to hearing from talented people. If you don't see an open role that fits, send a speculative application to careers@laiout.co.Tell us what you'd bring and why laiout resonates with you.

Sign up to our newsletter


.svg)
.svg)


.svg)

