Office vacancy just fell at its fastest rate since 2015. Here's what that means for landlords with vacant floors.
- US office vacancy fell 30 basis points to 18.3% in Q2 2026, the sharpest quarterly drop since 2015, while leasing activity rose 16% year on year to 62.4 million square feet.
- New construction has shrunk to 15.4 million square feet, 87% below its 2020 peak, so landlords are competing for tenants using the floor plates they already own, not new supply.
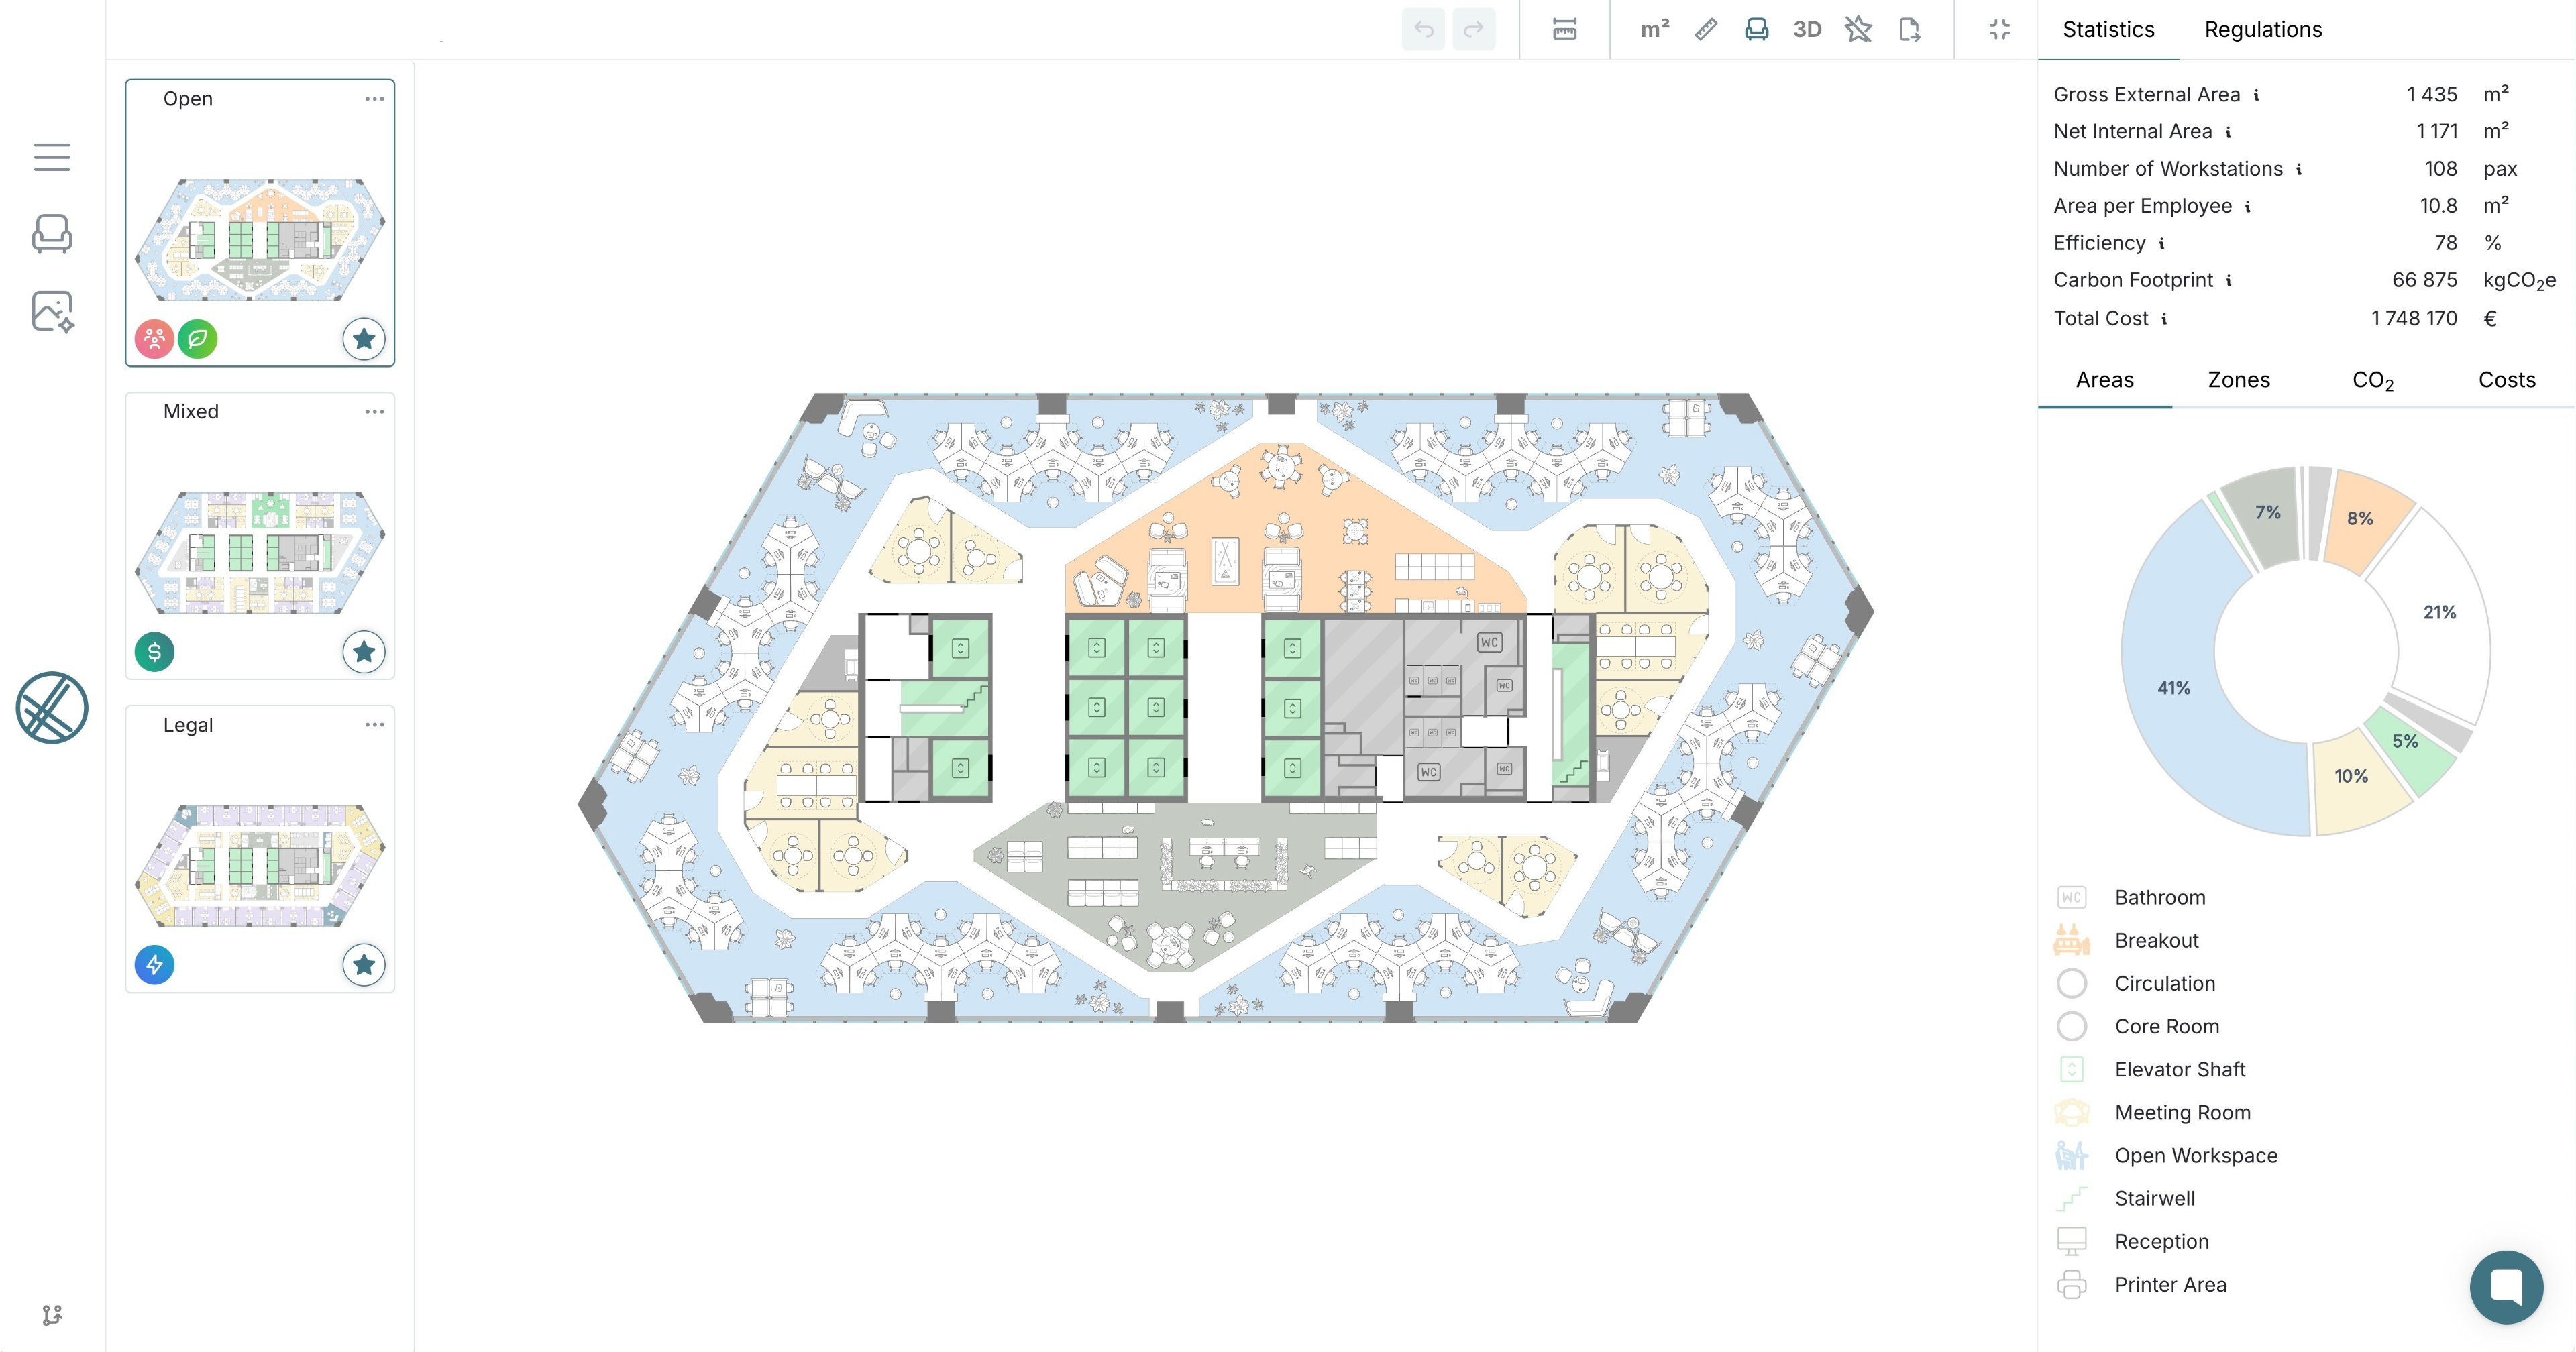
- laiout lets landlords show a vacant floor working for a prospective tenant in minutes, turning existing inventory into signed leases before a competing building gets there first.
US office vacancy fell 30 basis points to 18.3% in Q2 2026, the sharpest quarterly decline since 2015, according to a recent analysis of the latest CBRE data. Net absorption nearly doubled from the previous quarter to 12.6 million square feet, the ninth consecutive quarter of positive demand. For landlords, that is not a statistic to file away. It signals that tenants are moving fast, and the buildings that lease first are the ones that can prove a floor works before a rival owner does.
- Leasing volume is climbing while new supply is disappearing: Leasing activity accelerated 16% year on year to 62.4 million square feet in Q2, putting the market on pace to surpass 2022's record annual total, according to CBRE's Q2 2026 US office market report. At the same time, the construction pipeline has shrunk to 15.4 million square feet, 87% below its 2020 peak, with completions at their lowest first-half total since CBRE began tracking the market in 1990. Today's vacant floors are not a temporary overhang. They are close to the only inventory left to lease.
- The recovery is broad, not confined to a handful of markets: Cushman & Wakefield's latest MarketBeat data shows net absorption has turned positive in 60% of the 92 US markets it tracks, with the four-quarter rolling demand total hitting a six-year high. Landlords outside the usual gateway cities are seeing the same tightening, often without the marketing budget or in-house design team a large portfolio owner can call on.
- Prime space is absorbing demand fastest, raising the bar for everyone else: Prime vacancy fell to 12.3% in Q2, with Midtown Manhattan's prime rate dropping to just 2.2%. When trophy buildings capture this much demand, landlords with older or lower-tier stock have to work harder to prove their floor deserves a look, and a static CAD file rarely does that on its own.
- Rents are rising fastest in six years, which raises the cost of a slow lease-up: Average asking rents increased 2.6% year on year to $37.58 per square foot. Every month a floor sits vacant while a designer briefs and rebriefs a layout is a month of that rent growth the landlord isn't capturing.
Most landlords are still working from CAD files that need a designer briefed for every occupier enquiry. laiout Hub, laiout's centralised portfolio floor plan library, changes that. Every floor plate across a portfolio is stored, searchable, and ready to configure the moment an enquiry comes in.
- Configure any vacant floor in minutes, using templates for the tenants you see most: Upload the floor plate, set headcount and programme, and generate a compliant, lease-ready layout before the meeting ends. Reusable templates for recurring types, legal, creative, tech, financial, remove the blank-brief step entirely.
- Embed live, data-backed plans directly into your listings: Show density, room mix and configuration options on the listing itself rather than a static PDF, the same approach landlords are already using to make listings more compelling. In a market this tight, that turns more of the record demand into enquiries before a prospect ever books a viewing.
- Close the gap between viewing and commitment with AI renders: Every layout renders to a photorealistic standard tailored to a prospective tenant's preferences, the same speed advantage that wins competitive leasing markets, removing the uncertainty that delays a signature.
- See the real cost before committing capital, then export straight to signature: Every layout carries live cost and capacity data, so the return is a number you can defend, not a guess, the same ROI landlords are already seeing from AI-powered test fits. Export to PDF, CSV, 2D and 3D means a ready tenant never waits on a file only your design team can open.
Q: What is the US office vacancy rate right now?
The national office vacancy rate stood at 18.3% in Q2 2026, down 30 basis points from the previous quarter, the sharpest quarterly decline since 2015. Prime vacancy is tighter still, at 12.3%.
Q: Does this replace working with a broker or design team on a vacant floor?
No. laiout gives you a fast, credible layout to bring into that conversation already informed. Your broker and design team take it from there.
Q: How fast is "minutes" in practice?
A first layout generates in minutes from an uploaded floor plate. Comparing two or three configuration options for the same floor typically takes under an hour.
Q: Does this work across a whole portfolio, not just one building?
Yes. laiout Hub stores every floor plate across a portfolio, so any enquiry for any building can be configured immediately, without hunting through CAD files or waiting on a designer to locate the right plan.
Q: What does this cost for a landlord managing several buildings?
laiout is priced per square foot or square metre planned rather than per building, so cost scales with what you're actually configuring, and AI renders are unlimited fair-use across the whole portfolio.
Vacancy falling at its fastest rate in a decade, leasing on pace for a record year, and construction near a historic low are not three separate trends. They are the same story from three angles: tenants have less to choose from, and they are moving quickly on what's available. That shifts the advantage toward whichever landlord can prove a floor works fastest, not necessarily whichever landlord owns the best asset.
For portfolios with vacant space still sitting on a CAD file waiting for a designer's attention, that is a real cost. Book a demo with laiout today and find out how quickly your next vacant floor could go from enquiry to signed lease.
- US office vacancy fell 30 basis points to 18.3% in Q2 2026, the sharpest quarterly decline since 2015.
- Leasing activity rose 16% year on year to 62.4 million square feet, putting the market on pace to beat 2022's record annual total.
- The construction pipeline has shrunk to 15.4 million square feet, 87% below its 2020 peak, with the lowest first-half completion total since 1990.
- Net absorption has turned positive in 60% of the 92 US markets Cushman & Wakefield tracks, showing the recovery is broad-based, not confined to gateway cities.
- Prime vacancy fell to 12.3%, with Midtown Manhattan's prime rate at just 2.2%, raising the bar for landlords with older or lower-tier stock.
- Average asking rents rose 2.6% year on year to $37.58 per square foot, the fastest increase in six years, raising the cost of every month a floor sits vacant.
- laiout configures any vacant floor plate into a lease-ready layout in minutes, across an entire portfolio, from a single library of floor plans.
- Office Leasing Is On Pace For A Record Year As Vacancy Falls At Fastest Rate Since 2015, Allwork.Space, 30 July 2026.
- Q2 2026 US Office Market Report, CBRE Research, 2026.
- US Office MarketBeat Reports, Cushman & Wakefield, 2026.
Author: Theodore Harding, laiout
Get laiout News and Updates right in your inbox.

We're always open to hearing from talented people. If you don't see an open role that fits, send a speculative application to careers@laiout.co.Tell us what you'd bring and why laiout resonates with you.

Sign up to our newsletter


.svg)
.svg)


.svg)

